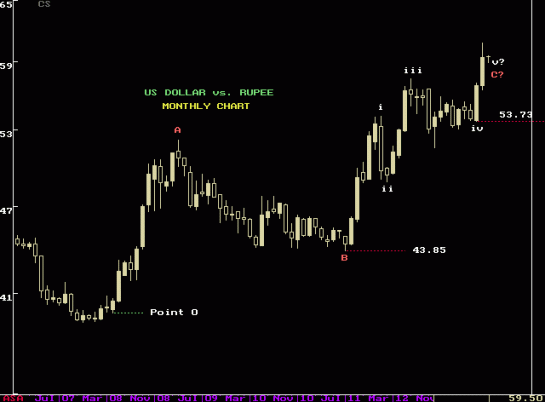
This is my first post on the analysis of US Dollar vs. Rupee chart. I would like to make it clear that I have tried to interpret the wave pattern using wave theory and general rules of logic, in spite of having a very limited data of free market conditions. As you know that charts of only those stocks, commodities or currencies can be studied under wave theory where a large public participation is involved. We have seen such a participation in terms of trading volumes, only in last few years.

I am considering a monthly chart beginning from April 2008 at the bottom of 39.77 (point 0). Wave ‘A’ took  about an year to complete and made a high of 52.18 in March 2009. That was followed by wave ‘B’ that retraced wave A by 61.8% and took a little over two years to terminate. Thereafter wave ‘C’ is in progress for last 2 years now.

DOLLAR


Wave ‘C’ can be interpretted as a terminal impulse pattern visibly much more sub-divided than wave ‘A’. Waves ‘ii’ and ‘iv’ overlap and wave ‘iii’ is shorter than wave ‘i’. Wave ‘v’ should therefore be smaller than wave ‘iii’. This means that wave ‘v’ must end below about 63.5.

If this interpretation of terminal impulse is correct then the entire wave ‘C’ should be retraced in less than 50% of the time it took to form.

This means if wave ‘C’ is over in next few weeks then the US dollar should crash below 43.85 in about one year. Before that happens the dollar should breach the level of 53.73 in shorter time than wave ‘v’ takes to terminate.

If the Dollar crosses the level of 63.5 vs. rupee then this interpretation is incorrect.

Last few years the fight is on with the Dollar dominating . We need some time to find whether the Rupee can turn the corner and emerge as the winner.
On a weekly chart, S&P 500 seems to be developing a diametric formation that I discussed long back (November 2012). The index has continued its uptrend since then and may be in its last wave G of this formation.

S&P2


On a monthly chart S&P seems to be forming an expanding triangle that began in the year 2000. Wave (E) of this triangle is yet to begin.

S&P3


It looks like we are nearing the end of wave G and wave (D) shown in the charts above. On a daily chart there seems to be still some steam left. After the consolidation pattern shown, we can observe the formation of a FLAT pattern. Wave B of this pattern looks like a downward sloping expanding triangle. We are right now in wave C of the FLAT pattern.

SANDP

Since wave B is an expanding triangle, wave C is not likely to retrace it completely. Even if does, it would take much more time than wave B. Wave A and B are similar in time, hence wave C would take much longer time around 8-10 weeks to complete.

In my last post, I discussed about bulls being trapped near the high of 6229 on the NIFTY. That turned out to be true and wave (a) from 5500 to 6229 was followed by a severe correction (almost 100%) in form of wave (b). Wave (b) seems to be a diametric formation that ended on 26th June 2013. Wave (c) is in progress thereafter.

NSE1

Waves (a) and (b) being similar in price and even time, wave (c) may become a terminal impulse pattern consuming substantial time of about 10 weeks (time of a and b put together). This entire structure then would probably become a FLAT pattern enclosed by the white channel shown.

NSE2


Eventhough wave (c) has started with a big bang covering 300 points on the NIFTY in just 3 days it would probably fizzle out. But since wave (c) is expected to be TIME consuming (than PRICE) the non-index stocks (mid-caps and small-caps) may outperform in the next few weeks.

In my last post on 17th May, I had mentioned about the possibility of a bull trap developing on the NIFTY charts. The failure of the indices to rally further for the last two weeks and the continued hesitation at the trend line shown in the chart confirms such a trap.

NSE1

On having a closer look at the NIFTY daily chart wave ‘e’ (and consequently wave ‘D’) looks incomplete. The wave seems to be sub dividing and we possibly are in part (b) of this wave. The entire wave ‘e’ that began at 5500 on the NIFTY may subdivide as a-b-c or a-b-c-d-e.

NSE2

We remain cautious at this point since there has been a faster retracement of the upmove 5970-6229 during the fall 6229-5936. As per wave theory the pattern looks incomplete at the top, but such things can occur at the major turning points.

Anyway even if the wave developes into an a-b-c pattern, then there is still some steam left in the rally.

But then that would become an even worser TRAP !!

NIFTY achieved its first target of 6150 this week, as discussed in my last post. The movement is still too simple i.e. too swift to indicate any topping formation. I still continue with my assumption that the ongoing rally is ‘e’ wave of a Neutral Triangle that began in January 2012.

NSE1


The wave has yet not shown any loss of momentum eventhough stochastically the market is overbought on Daily as well as Weekly time frames. Anyway the market is not bothered about that.

Now let us observe the same chart from a different perspective.

The current rally (wave e) has completely retraced the fall (wave d) in much shorter time. Such an action usually begins a new wave. Then is the consolidation phase from Jan 2008 over and is the market entering a NEW BULL PHASE ? Many may think and even wish that to happen. But if you observe the larger wave ‘D’ has taken more time than wave ‘C’ and has not yet retraced it completely to make a new all-time high.

NSE2

Some may argue why not begin the new bull run from the end of wave ‘d’ marked as ‘point 0’.

NSE3


Let us observe this rally for the next few weeks. If you observe the red dotted trend line was breached by the market last week. This week also the Nifty has closed above the line but has 50% of its portion is below the trend line. That means the market hesitated at this line. If the market begins a new move there should be no hesitation at all. On the contrary the break occurs violently never to return to the line. This is an important aspect of technical analysis.

In the next one or two weeks, if the index again turns down and breaks the trend line we can be sure that this attention-seeking rally is NOT a New Bull Run but just a NEW Bull Trap !!

The downward Diametric pattern that began on 29th January 2013 did make a bottom at 5477 on the day I published my last write-up but ended at a later date, at higher bottom of 5500. I was expecting the following upmove to be an x-wave that retraces this whole pattern by not more than 61.8%. In that case the rally shouldn’t have crossed 5861 on the NIFTY, but it did. Up till now it has retraced the entire fall by about 70%.

NSE1

Consider two aspects:

1)  The rally is violent enough to be mark the commencement of a NEW upward pattern and not a part of the downmove.

2)  The fall from Jan 29 to April 10 is NOT BIGGER than the fall from January – June 2012.

Both these things force me to reconsider my earlier labelling. I feel that wave ‘D’ that began in January 2012 is not yet over. Due to the complexity on the daily chart we observe this on a weekly perspective. It looks like a Neutral Triangle (in which wave ‘c’ is the longest and usually the most complex wave) is developing. We are right now in wave ‘e’ of this triangle.

NSE2

Wave ‘c’ being quite complex wave ‘e’ could be around 61.8% – 100% of wave ‘a’.

This sets the target of 6150 – 6500 on the NIFTY in the next 3-4 months.

This view will be negated if the market suddenly reverses and breaches 5477 in the next few weeks.

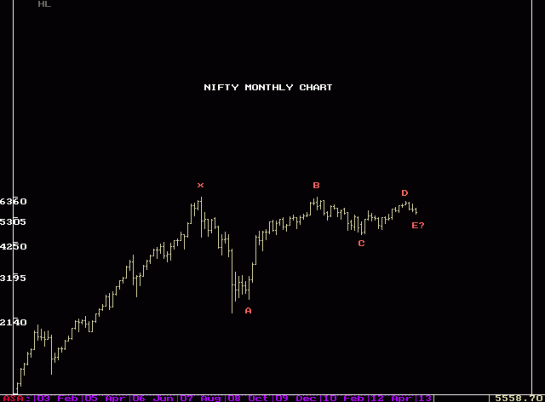
Last time I wrote, wave E on Nifty Monthly Chart had just begun.

NSE2

Till now the downmove has sub-divided and looks like a diametric formation with seven legs a-b-c-d-e-f-g as shown in the diagram. This is called a ‘diamond’ shaped diametric within which the pattern first expands and then contracts (as far as the trend lines are concerned). This pattern that began at 6111.8 on 29th January 2013 is probably over today i.e. 10th April 2013 at 5477.2 taking 49 days.NSE1

This would be followed by x-wave and then another corrective pattern. This x-wave may retrace this entire fall by 40-50 % but not more than 61.8% usually. That means we can expect the index to rally to 5700 – 5800 levels and then remain range bound (5500 -5800) for a few weeks time before commencing the next downward move.

Nifty confirmed the beginning of a downward wave by falling about 450 points, which is bigger than any intermediate fall during the rally from June 2012 bottom. Thereafter the index has rallied by  almost 300 points in just four days. This confirms that wave ‘a’ of the down-move is complete and wave ‘b’ has begun. This wave ‘b’ could turn out to be a Flat pattern, a Contracting triangle or even a Diametric. Right now, I can only say that the pattern in wave ‘b’ position is likely to be a non-directional one oscillating between two values of NIFTY (5663 and the other yet to be confirmed).

NSE1

During my last few posts about NIFTY, many had doubts and queries about the structure I had presented for the entire FLAT pattern (a-b-c) from January 2012 to January 2013, especially the pattern in wave ‘b’ position.

Wave ‘b’ here is a Neutral Triangle having five legs from A to E as shown.

NSE2

Neutral triangle being a newly discovered pattern under NEoWave, not much is known about its occurrence in real time charts, especially in Indian markets. I do not know whether it can occur as wave b of a FLAT pattern, but I am assuming so. Since the pattern terminates at a much higher level (5217) instead of 4770, my only requirement was a swift and violent break-out crossing the top of the triangle (5630). Since that has actually taken place as wave 1 of wave ‘c’, I am assuming that my interpretation is fine.

NSE3

As per NEoWave theory, FLAT pattern is the only place where wave b can consume substantially more time than wave a. According to Glenn Neely, time of wave b could go up to 5-6 times that of wave a. In the above mentioned FLAT pattern, wave ‘a’ has taken 30 days and wave ‘b’ has consumed 137 days. In such a case wave ‘c’ must take at least about half the time of a and b combined i.e. 84 days. In our chart wave ‘c’ has taken 98 days to complete.

If wave ‘c’ is assumed to begin at 4770 instead of 5215 then several important rules like extension rule, touch point rule have to be broken. In general, I am not in favour of breaking any rule.

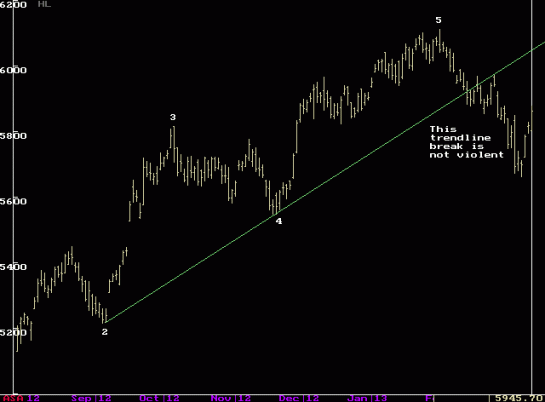
One more aspect of the post impulse behaviour is that the 2-4 trend line is broken vilolently by the market confirming end of an impulse pattern. This is not observed during the recent fall of NIFTY if wave ‘c’ is assumed to begin from June 2012 bottom.

NSE5

It appears now that in the intermediate term we are in wave E of the pattern that began in January 2008. This wave may roughly follow the path shown by the dotted line.

NSE4

It remains to be seen whether it falls below 4531 or not in the coming months to decide what the larger picture looks like.

A complete reassessment of the presented pattern would be required if the index makes a new 52 week high (above 6112) in next few weeks. 

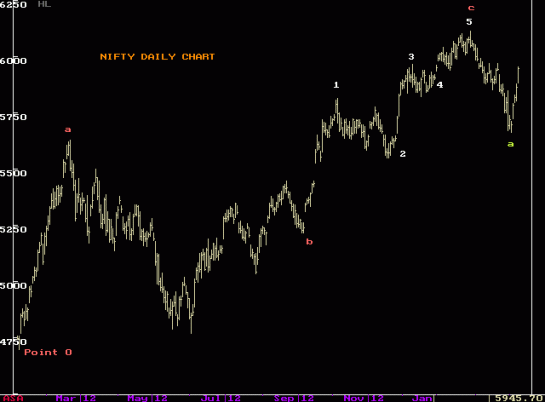
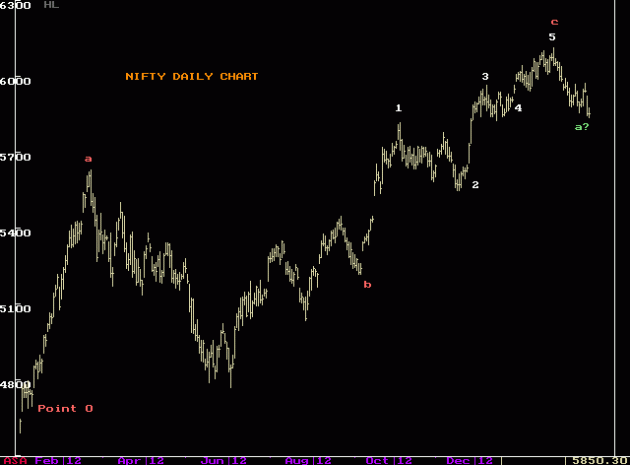
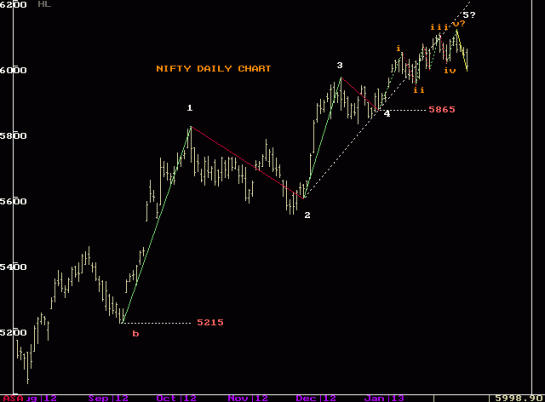
NIFTY topped at 6111.80 on 29th January 2013 on a positive but expected RBI policy news and has fallen thereafter by almost 300 points in last 18 days. With this fall we can end wave ‘5’ within wave ‘c’ of the FLAT pattern that began in January 2012. Image

I had mentioned in my last write up that NIFTY should fall below 5865 before 14th February 2013. But NIFTY breached this level on 15th February. When I had a closer look at the intra-day charts, it appears that the terminal impulse wave ‘5’ had begun at 5898 instead and this has been retraced in less than 50% time as shown.

Image

Hence I am assuming that the terminal wave ‘5’, wave ‘c’ (in five parts 1-2-3-4-5), and the FLAT pattern a-b-c all are over and a new down trend has begun. This will be marked as wave ‘E’ of the larger pattern that began in January 2008.

Image

We can expect this down trend to continue at least for the next 8-9 months and break 5215 as mentioned in my last post.

A complete i.e. 100% and faster retracement  of an up move in Nifty occurred after the top of 6111.80 on Jan 29, 2013. This probably confirms an intermediate top at this point and also the end of a FLAT pattern that began about an year back in January 2012.

As I have already discussed in my last two posts that the ‘c’ wave of this FLAT pattern was a 1st extension trending impulse within which wave ‘5’ looks like a Terminal Impulse that typically oscillated about the 2-4 trend line.

NSE1

We can visualize this in a better way in the following diagram.

NSE2

Further to confirm this terminal, NIFTY must fall below the starting point of the terminal i.e. 5865 in 50% time it took to form. That means NIFTY should break this level before 14th Feb. 2013.

As per NEoWave observations, if wave ‘5’ is terminal in an impulse pattern then probably the entire impulse pattern is retraced thereafter. This leads us to a conclusion that, if my interpretation of the index pattern is correct, then NIFTY should even break the level of 5215 in the next few months.

NSE3

This fall will eventually mark the beginning of another downward wave that would form the next leg of the huge consolidation pattern that began in January 2008.

NSE4

We now continue to follow the market in the coming weeks to find whether its movements justify my stand.