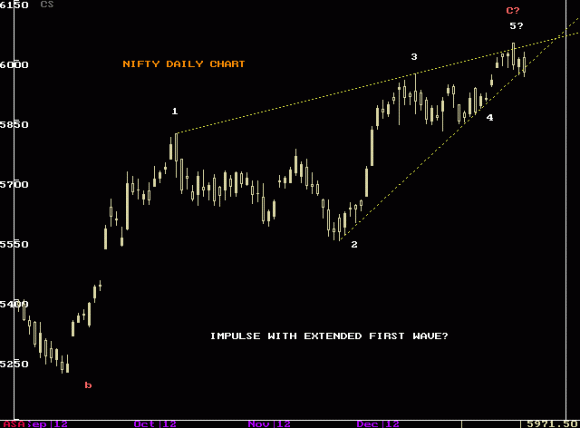
The increasing complexity i.e. the overlapping and subdivided structure of the present rally confirms my view of ‘Bull market losing momentum’ I discussed in my last write-up.

It looks like the index is forming a terminal impulse pattern in wave 5 position. It is clear from the way the market is weakly pushing up that we are close to an intermediate top. We can easily observe that wave 5, instead of moving away from the 2-4 trend line, is oscillating about the line.

NSE2

If I remove the price candles from the chart and keep only lines representing the waves then this fact stands out even more distinctly.

NSE1

To confirm this view, this slow overlapping rally must end soon forming a market top at least for the time being.

About a month back, in my last post on NIFTY, I had discussed an alternative possibility for the ongoing impulsive wave ‘c’. That alternate count seems to be more appropriate if one has to follow some important rules of NEoWave theory.

One of them is a touch point rule, that says out of the points 0-1-2-3-4-5 in an impulse wave, not more than two points should lie on the same straight line.

Secondly, wave ‘c’ usually can take a maximum time equal to that of wave ‘a’ and wave ‘b’ put together and that too when wave ‘c’ is a terminal impulse.

THIRD most important point is the rule of extension in an impulse. It says that the longest wave in an impulse should be more than 1.618 times the next longest wave.

All these rules have to broken in the first alternative shown below.

NSE1

With a shift in the termination point of wave ‘b’, shown below, all these problems disappear. Hence I am considering this to be a more appropriate pattern interpretation.

Image

Now we find that wave ‘c’ seems to be a proper trending impulse wave with extended wave 1. Further it follows the touch points rule also. It is also showing the characteristic contracting shape of a first extension impulse wave.

Image


Now the entire FLAT pattern from January 2012 seems to be developing as shown below.

NSE3


If this interpretation is correct, then we are very close to an impending top.

We hold on to the expanding triangle scenario I explained last time. For the last 10 days S&P has been moving in a narrow range above 1403 but below 1434. The level of 1434 is crucial on the up side to continue with the same view.

Right now we are in wave ‘d’ of expanding triangle. If that is so, wave ‘e must break the bottom of wave ‘c’. Even though wave ‘e’ of an expanding is large and violent, usually it is slower than wave ‘d’ i.e. it takes longer time to retrace wave ‘d’ completely.

SANDP


Wave ‘d’ is already much longer in price and time than wave ‘b’ which does provide perfect alternation between these two waves. Hence time is running out for wave ‘d’ to finish off. Wave ‘e’ must start sooner than later this week.

If not, the market has something else in mind.

I wrote last time that bear market has finally begun for the US markets and the first downward pattern seems to be a downward sloping expanding triangle. We are right now in wave ‘d’ of this triangle. For this structure to remain valid S&P should not move above 1434 i.e. wave ‘d’ should not become longer than wave ‘c’.

Till now the index is within the range of 1403-1434 in the past week. So we hold on to the expanding triangle scenario. Wave ‘e’ must start sooner than later and must cross the bottom 1343 and preferably 1266 thereafter.

SANDP

In case S&P turns down but does not cross 1343 and on the contrary starts rallying again then this interpretation of the expanding triangle and in turn the bear market is wrong. Such a behaviour would only mean that the bull market that began in March 2009 is not yet over and has some more price and time to consume.

Anyway we need to follow the market and cannot dictate its progress !!

In my last post I had mentioned that wave ‘4’ looks unfinished and is about to terminate. It took about 30 days for wave ‘4’ to get over and wave ‘5’ to begin. If this interpretation is correct then this would be last wave and hence the last rally of the current pattern.

NSE1

Beginning from January 2012 the pattern thus getting completed is called a FLAT pattern having 3 legs a, b, c. Wave ‘c’ has sub divided in 5 parts 1, 2, 3, 4, 5 of which the last leg wave ‘5’ is in progress.

Alternate Possibility

In a FLAT pattern usually wave ‘a’ is a violent and simple (i.e. not much subdivided) move. Wave ‘b’ is usually time consuming and complex (subdivided). We observe both these characteristics here. Wave c is impulsive and usually takes 50% time of ‘a’ and ‘b’ together. If wave ‘c’ is a terminal impulse it may take time up to that of a+b.

NSE2

In the FLAT pattern in progress, we find that wave ,’c’ has already exceeded time of a+b in spite of being a trending impulse. Also point 0, 2 and 4 lie almost on the same straight line which is uncharacteristic of an impulsive wave.

NSE4

These things raise a doubt whether wave ‘b’ ended at the point shown or it has ended at a higher bottom shown in the chart below. In that case wave ‘3’ (and not wave ‘5’) of wave ‘c’ is in progress.

NSE3

If so,it is possible for wave ‘c’ to continue its progress for a few more weeks.

If not, the current rally in NIFTY is the last one before the impending top.

I had explained two possible scenarios, in terms of the wave structure labeling, for the recent fall in S&P 500. I had mentioned ” If we see a substantial bounce back taking the index up to 1403-1434 range then expanding triangle is the preferred count”.

S&P has rallied thereafter to close today at 1408.35. I am assuming this rally to be wave ‘d’ of an expanding triangle (a-b-c-d-e). The sharp reversal that occurred at the bottom (near termination of wave ‘c’) is a typical characteristic of an expanding triangle.


For this count to remain on track wave ‘d’ must end in the range 1403-1434. If it crosses 1434 then this count and even the weekly structure has to be modified with some relabeling.

If this count turns out to be right then within a few days, once wave ‘d’ gets over, an extremely damaging downward wave ‘e’ should get underway.

We need to wait for some more days to find which way the market moves.

It is almost certain now that the bull market that began in March 2009 is finally over. The ultimate confirmation would come when the the index falls below its June low of 1266.74.

As I discussed in my last write-up, the mood of the market participants has clearly become bearish. It will continue to be so in spite of any good news or any desperate efforts by the governments to prevent the fall.

I have always mentioned in my earlier posts that the move which qualifies for the beginning of a new trend should be simple i.e. it shouldn’t be sub-divided. The recent fall in the S&P has that characteristic. Secondly this is the biggest fall from the bottom of June 2012.

For the downward pattern, there are two possible interpretations in the short term. Either the new pattern has begun at top T3, because the wave following that has retraced the prior up move in shorter time. The pattern then looks like an a-b-c structure up till now. The structure may be a part of a running expanding triangle a-b-c-d-e .

Another possibility is that the pattern may have begun at the top T4 and this could be just the first wave a of the pattern.

.If we see a substantial bounce back taking the index up to 1403-1434 range, then expanding triangle(first chart) is the preferred count.

In any case the markets are likely to undergo severe damages in the near future.

<<<The level of 1396 on the S&P was finally broken this week. Observe the chart below. After wave ‘b’, once the market crossed 1396 (on the upside) on 7th August 2012, it not only remained above but also hesitated to go below this for next 20 days. This was then followed by a huge bull candle. .

Now in the downturn again the market showed reluctance to cross 1396 for a few days but finally cracked below.

Now once there is a crack many are talking about the fiscal cliff and the euro zone worries.

But the point to note is that the index has made a top on 14th September 2012 on an extremely  Bullish announcement of unlimited quantitative easing (QE3) by the FED. A top formed on a very positive note is usually difficult to surpass for a substantial amount of time.

Due to the complexity of the structure from June 2012 bottom, I had mentioned in my post on 31st August 2012 that the markets are close to a turning point and a bear market may begin irrespective of the FED action. That is what exactly has happened in the last two months.

On the weekly chart also the trend line joining the previous bottoms (D-F line) has been the cut and the index has closed below the line.

The mood seems to have clearly changed from bullish to bearish. That’s the reason the markets gave a Big Thumbs Down to president Obama getting re-elected.

For the big players, right now, ANY NEWS is just BAD NEWS !!

Last time I wrote that wave ‘3’ within wave ‘c’ of the ongoing Flat pattern in Nifty has probably got over. The index, since then, has not made a new high and has been moving in a narrow range of about 200 points for the past 20 days. This, more or less, non-directional movement is definitely not a part of wave 3 but, on the contrary, forms wave 4 which is correcting wave 3.

Once this wave 4 is over we can expect the last part of the impulse i.e. wave 5 to begin. Now since wave 1 and wave 3 are almost of same length (wave 3 is slightly longer than wave 1), wave 5 can be expected to be much different.

Out of the two counter-trend waves, wave 2 being more time consuming and complex than wave 4, we can expect wave 5 to be short. It may just be 0.618 times of wave 3 in length. In that case wave 5 may get over in the range of 5900-6000 on the Nifty. The corresponding range on the Sensex is around 19500 – 19800.

We may have to wait for a few more weeks for these wave 4 and 5 to terminate, that would end even a larger degree pattern.

Last post I wrote ” The daily pattern looks more like a distribution  rather than a consolidation”. That has turned out to be so till now with S&P coming very close to its crucial support level of 1396.56. This was the value from where the last directional action had begun, marked as wave e on the chart


The hurricane Sandy forced the US markets to remain closed on 29th and 30th October. If markets reopen on 31st October, the crucial level to be watched right now is 1396 on the S&P. If the index breaks that level and accelerates downwards then we can be almost sure that the bull run is over. If not, then there is still some steam left.

Do you agree that the value of 1396 on the downside is crucial psychologically ?